 In the context of service reporting, it is crucial to have the ability to succinctly summarize the raw data.
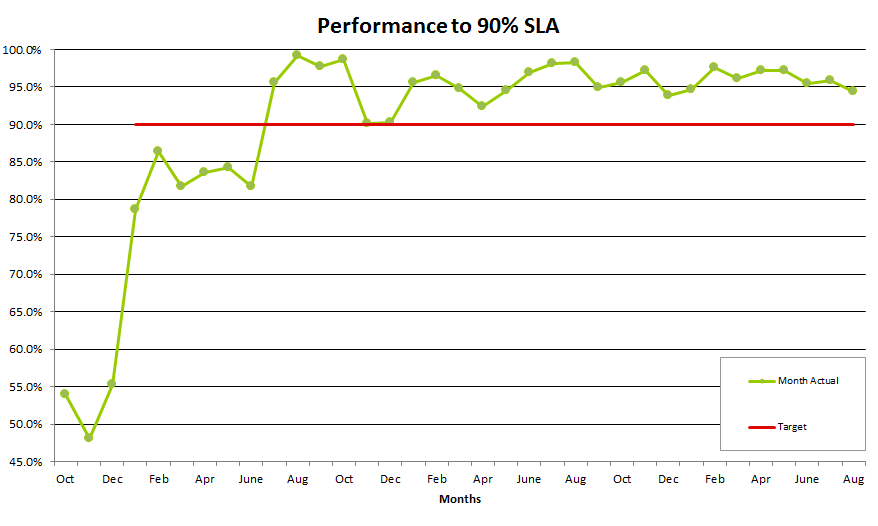
As a director, it is important to understand that your managers are dealing with the day-to-day realities of the company: your peers however receive the reports only once a month (or perhaps even less often). They rely on others to interpret the information for them. It is not always easy to determine if performance is improving or deteriorating, and charts can be difficult to interpret. In a chart, is the performance data above a Service Level Agreement (SLA) line a good thing or bad? Is a problematic situation now under control? ... or has complacency led to the loss of process control?
As demonstrated in the Decision Making workshop, not everybody can interpret numerical data or charts with equal ease. It is probably not obvious to your managers how one simple change to a chart can remove all doubt.
The manager may need to present different and more detailed charts to their team, the people doing the work. This will affirm to the team that their manager has got their finger on the pulse. The team can also see any trends in the wrong direction: they don't need the meaning spelling out to them.
